business intelligence
-
Analytics
Active vs Inactive Relationships in Power BI: What They Are and Why They Matter
When you start building data models in Power BI, one of the first things you’ll realize is that not all…
Read More » -
Chart Libraries
How to Build Stunning Data Visualizations in Python with Matplotlib and Plotly
Introduction Visualization is the skill that gives this data a voice, transforming numbers into clear, compelling stories that drive decisions.…
Read More » -
Analytics
Power BI vs. Looker Studio: How To Choose The Right BI Tool for Your Marketing Team in 2026
Introduction Choosing the right Business Intelligence (BI) tool for your marketing team in 2026 can feel overwhelming. You’re constantly told…
Read More » -
Analytics

Power BI vs Looker Studio vs Tableau: How to Choose BI Tool in 2025
Struggling to pick the right data visualization tool in 2025? Choosing can be tough, especially with various great choices out…
Read More » -
Analytics
New BI Analyst’s Guide to Joining Ongoing Business Intelligence Projects
Introduction Joining an ongoing Business Intelligence (BI) project as a new BI Analyst can be both exciting and challenging. While…
Read More » -
Analytics

How Business Intelligence Analysts Thrive with Busy Stakeholders
Introduction In the fast-paced world of business, stakeholders and business executives are often preoccupied with pressing matters, leaving little time…
Read More » -
Analytics
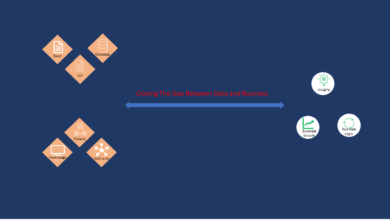
Closing the Gap between Data and Business: The 5 Key Area to Focus
The modern business world is heavily dependent on data, closing the gap between data and business is essential to business…
Read More » -
Analytics
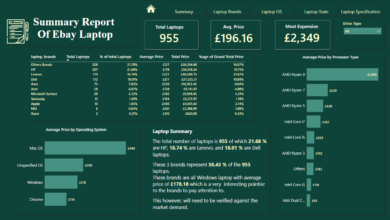
Easy to use Analytics and Reporting with Power BI
Building an easy to use analytics and reporting with Power BI helps enhance the capabilities of self service BI tools. …
Read More »