Building an easy to use analytics and reporting with Power BI helps enhance the capabilities of self service BI tools.
Before developing a report, it is important that the developer has a fundamental understanding of best ui/ux design principles and storytelling.

Some Best Design Principles in Storytelling
People usually consume data from top left to right and top left to bottom. This means when designing your interface, your most important KPIs should be at the top left while the least important stays bottom right.
Another best practice also says there should be not more than 8 visuals per report. Personally I limit mine to between 4 and 6 visuals excluding cards.
The other one I will mention here is the use of colour, I personally don’t use more than 3 colours. I try as muas I can to limit it to 2. What I do is use 2 colours and supplement with a lighter shade of them
Colours add contest to your report, if you chose red to represent category A, please ensure that you continue using red for that category, this will make it easy for the consumer to remember that red means category A when he/she sees it.
It is worthy of note that:
✍️ So many visuals in one report or dashboard does not necessarily equal good report.
✍️ Multiple colours in a report or dashboard does not equate to beauty
A beautiful report or dashboard is one that effectively answers the questions asked in the problem statement.
It doesn’t matter the high level of aesthetic and numerous visuals you add to your report, if it does it answer the question(s) easily, then it is a waste. While you think of beauty, please remember to put the objective first.
Project Background
This article is the reporting and final stage of the end to end etl project. Here, I made an easy to use analytics and reporting with Power BI.
To easily follow along, you need to have working knowledge of Power BI, Power Query and DAX. This is a single table dataset, hence there will be no data modeling.
Dataset
The dataset was scraped from ebay product. A collection of fairly used laptops for market survey. The dataset lives in a postgres database. You may want check my article on how I scraped the data 👉 Beginner Friendly ETL Project with Python Postgres and Power BI.
Transformed the data 👉 Easily Transform Data Using Pandas and Regular Expression and finally uploaded the data into a postgres database 👉 How to Efficiently Load Data into Postgres using Python.
Connecting into Postgres Database with Power BI
The two interfaces provided to connect to data sources are from the Power BI and Power Query. Choose what works for you. However you go about it, always remember to choose transform option instead of load.
This is simply because more often, you want to transform your dataset to meet your business needs and effectively answer your question.
How this thing works is that, if you spend time building an efficient data model, you will spend less time writing DAX functions.
On the other hand, an efficient data model is also dependent on well transformed entities. For best practices, any function that you can do on both power query and DAX level, you should do it at the power query level.
I connected to the database through the postgres connector available in Power BI. These connectors are available to both free and paid users.
Transformation
There are just a few transformations needed, since most of the transformations have been taken care of with pandas and regex.
The dataset for transformation with power query

The transformations performed on the dataset are:
👉 Replace the value ‘to’ with empty space ‘ ‘ in laptop_price column.
👉 Split laptop_price column and delete the unwanted columns.
👉 Remove the £ symbol, we will change it to currency in Power BI
👉 Filter out all price in USD since the target prices are in GBP
👉 Carefully investigate prices less than £30 to be sure they are laptop.
👉 All null values in drive size and ram were replaced with 0
The dataset after transformation with power query

DAX Functions
After the transformation, next was to load and close. Then I created 7 calculated measures and 1 calculated column inline with the KPIs from the problem statement. Everything you need to know about data analysis expression These measures are:
👉 Percentage of Total Laptops
👉 Percentage of Total Price
👉 Average Price
👉 Most Expensive Laptop
👉 Total Brands
👉 Total Laptops
👉 Total Price
👉 Laptop Current State
Reports
When building this report, I considered the colours(I wasn’t given any colour here, hence I am free to choose the colours I want), I always research for colours that complement each other.
As soon as I made up my mind with the colours, I started considering structure. Now since I am building 4 different reports and 1 summary, I reduced my number of visuals to a maximum of 4. They are tables, bar charts, doughnut charts and cards.
UI/UX Design
In designing a dashboard or report, you need to consider the different types of consumers, here I built this with only web consumers in mind. This is the reason it is not responsive.
Another thing you need to put into consideration is that the UI needs to make the UX beautiful. From the reports you can see that I made use of relatively appropriate icons and the navigation is 100% accurate.
By doing so, the consumer will not find it hard to go to any page they want to go to.
Primedsoft’s Recommendation
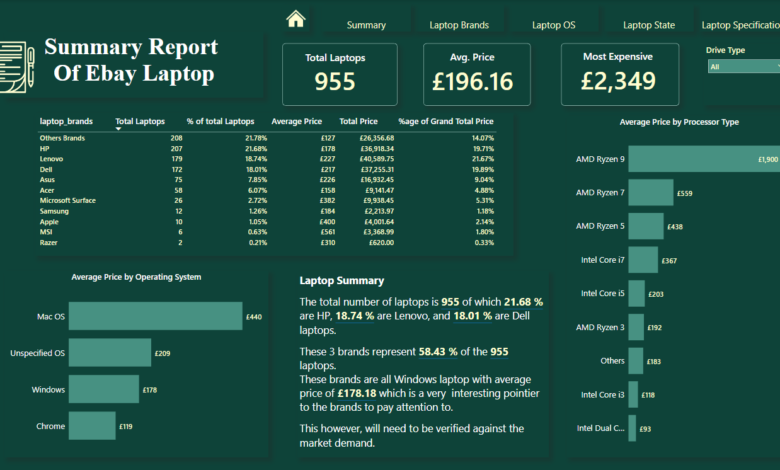
After very careful data cleaning, transformation, analysis and visualization below is the final version of the project and the insights and recommendations are on each page of the report.
Conclusion
In this article I have walked you through how I built an Easy to use Analytics and Reporting with Power BI. Building or developing a Power BI report is as much science as it is art. You need to add your creativity, however, you creativity must answer clearly the questions being asked by the problem statement.
Let me know what you think in the comment section. I am open to making it better. Keep practising till I come to you again with a new article.