A slow dashboard isn’t just an inconvenience. It can cost teams time, insight, and credibility. Whether you’re reporting on sales trends, tracking project KPIs, or visualizing web traffic, your dashboard should deliver insights quickly and smoothly. This is why you need to understand ways to build efficient Looker Studio dashboards.
Looker Studio dashboard performance depends heavily on these 4 main reasons:


- The underlying dataset
- The amount of data that is being queried
- The complexity of those queries
- Network latency
In this article, we will focus on the underlying dataset in Google Sheets. You will learn practical and proven ways to significantly improve your dashboard’s performance without sacrificing user experience and aesthetic user interface.
Whether you’re a data analyst or business decision maker, these steps will help you deliver faster, and more efficient dashboards that drive better decisions. They are:
- Preparing your data
- Loading your data
- Creating optimized views
But first, let us understand why your dashboard runs or refreshes slowly.
What Causes Slow Dashboard Performance in Looker Studio?
- Complex or Heavy Calculations
- Multiple Data Sources and Excessive Blending
- Dynamic Live Connections Without Caching
- Overloaded Dashboard Design
Three Key Areas for Building Efficient Looker Studio Dashboard
 Overview of the dashboard optimization process in Looker Studio
Preprocessed Data at the Source
Effective dashboards don’t start inside Looker Studio, they start by organizing and preparing clean, simple, and structured data. Think of it like building a house: before your interior decoration, you would have designed and built all the different rooms/parts that make up the house. If your data source is not well prepared and structured, then you will face a poorly performing dashboard.
Now, let’s take a quick dive into how you prepare your data at the source before integrating into Looker Studio:
Consolidate and Pre-Aggregate Your Data
Looker studio is not your data source, hence pulling in all tables, columns and rows is not necessary. Here are the steps you take to get your Google Sheets data ready for extraction into Looker Studio.
In Google Sheets, use the QUERY() function to pull only the rows and columns you actually need.
Pre-aggregate data by grouping it before importing (for example, total sales per day instead of every single order).
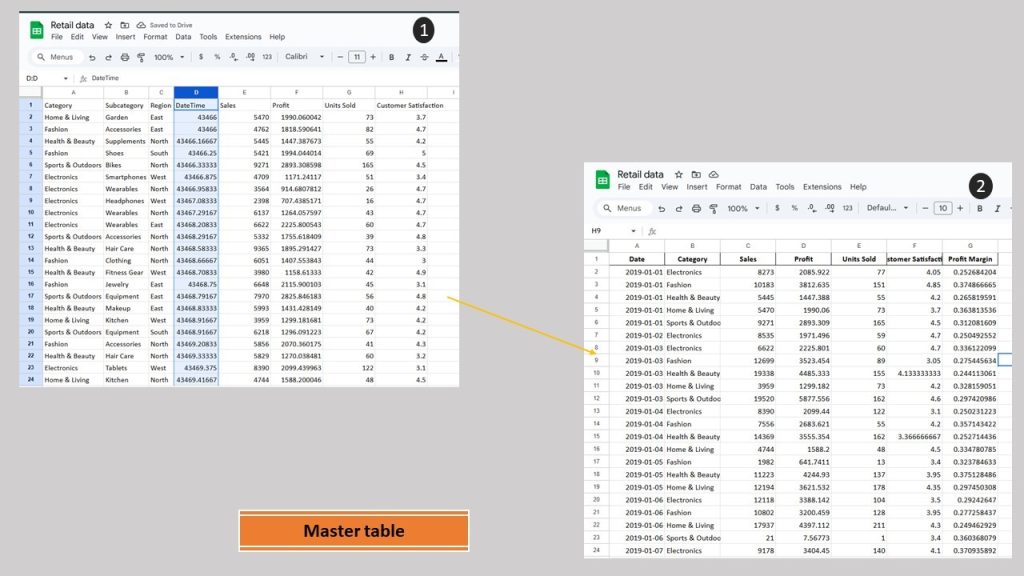
Consolidate multiple sources into one master table/sheet.
Example:
Instead of analyzing 10,000 sales transactions in Looker Studio, summarize them into daily totals within Google Sheets first. That way, Looker Studio only needs to work with a few hundred rows.
Think of Looker Studio as a chef trying to serve meals quickly. If the chef must chop vegetables, cooks the meat, and bake the bread every time someone orders, service will be slow. Similarly, if Looker Studio has to calculate metrics (like profit margins) on the fly, dashboards become sluggish.
- Prepare those “ingredients” ahead of time inside Google Sheets.
- Create columns for things like Profit, Revenue per Product, or Conversion Rate.
- Calculate them once and save the results as part of your dataset.
Instead of calculating Profit = Revenue – Cost, every time a Looker Studio dashboard is opened, add a “Profit” column to your master data in Google sheet.
Loading Data into Looker Studio from Google sheets
Now that you have successfully optimized your data source prior to extracting it from Looker Studio, the next way to optimize looker studio dashboard performance is on how you load the data.
Even with perfectly prepared data, how you ingest it into Looker Studio makes a big difference in performance. Here’s how to load smartly:
Use the Extract Data Connector to Create Static Snapshots
Imagine if, every time you opened a book, the pages had to be printed from scratch. That’s what happens when dashboards query live Google Sheets or databases every time they load. Looker Studio’s refresh frequency for Google Sheets is every 15 minutes, 1 hourly, 4 hourly and 12 hourly. Here is what I recommend:
- Use the Extract Data Connector in Looker Studio to pull a static snapshot of your dataset.
- Choose only the necessary fields as recommended in the pre-processed stage.
- Refresh the snapshot automatically every 12 hours at a minimum.
If you need earlier refresh, please consider using Google Big Query as your data source. See this video for a complete guidance on data refresh in Looker Studio
Benefits:
Instead of making Looker Studio “reprint” the book every time, it reads from a saved copy much faster.
Enable Caching and Manage Data Freshness
Constantly fetching fresh data is like asking for a weather update every 10 seconds, even if the weather hasn’t changed, which brings us to caching. A very potent way to improved dashboard performance and save cost
- Turn on caching in Looker Studio so it remembers recently loaded data.
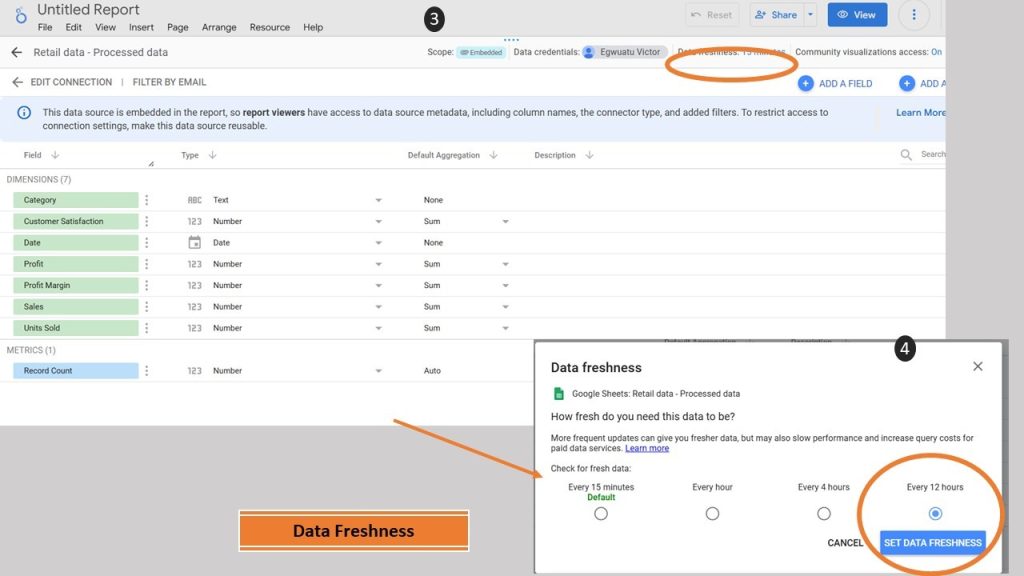
- Set the Data Freshness setting to a practical interval, like every 12 hours.
- Reserve shorter refresh intervals for truly dynamic, fast-changing data source (like live dashboards and remember, for live dashboard, please consider using Google Big Query as your data source).
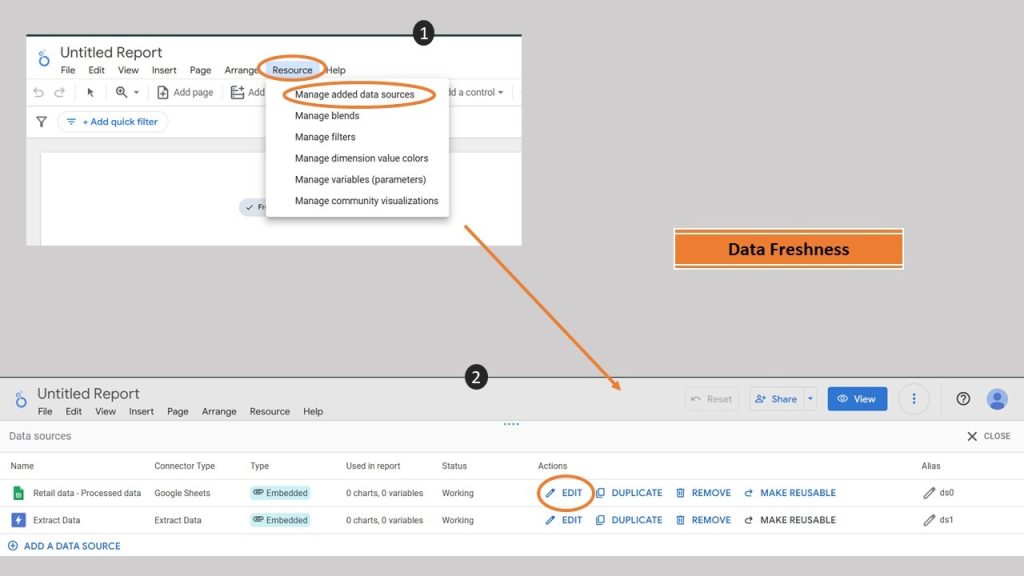
Steps on how to Set Data Freshness:
- Go to Resource > Manage Added Data Sources.
- Edit the settings for your source.
- Set your desired refresh interval under Data Freshness for the selected data source.

Creating Views in Looker Studio For Efficient Dashboard
Even with clean data and smart loading, a cluttered dashboard can still grind to a halt. Designing your views thoughtfully is the final step to a fast dashboard. To help improve dashboard performance on the report view;
👉 Set Default Filters to Reduce Initial Data Load, ensure it defaults to a limited data range of about the last 30 day, or 90 days or even custom ranges tailored to your analysis. This way, dashboards only pull relevant, recent data unless the user asks for more.
👉 Simplify Dashboard Layouts. A dashboard crammed with too many charts, tables, and filters is like trying to watch 10 movies at the same time you don’t know where to look, and everything lags. Here is my recommendation:
- Limit each page to 4–6 key visual elements (charts, scorecards, tables).
- Use tabs or navigation pages to separate sections rather than piling everything onto one page.
- Avoid heavy data blending or too many nested controls in one place.
Pro Tip:
Design each dashboard page around one main question you are trying to answer.
A focused page loads faster and delivers clearer insights.
Best Practices for Long-Term Performance
- Always prepare your data (filter, pre-calculate, and aggregate) before connecting to Looker Studio.
- Consolidate sources into master tables wherever possible.
- Schedule refreshes wisely to balance performance and cost.
- Design with clarity and simplicity in mind: fewer charts, clearer layouts, and smarter filters.
- Test dashboards across devices and with real users for true performance validation.
Common Pitfalls to Avoid
- Overdesigning dashboards: Too many charts per page increases load time.
- Referencing full column ranges (A:A) in Google sheet instead of defined ranges (A2:A5000).
- Using IMPORTRANGE() heavily: It slows down both Sheets and Looker Studio.
- Loading raw transaction-level data when you only need summaries.
Conclusion and Next Steps
Improving dashboard performance isn’t about cutting features—it’s about designing with speed in mind. You have learnt how to improve dashboard performance in looker Studio through these three steps. By;
Preprocessing data in Google Sheets before it reaches Looker Studio,
Reducing charts complexity, and
Offloading logic from Looker into Google Sheets, you can cut load times and improve user experience significantly.
Do you need help optimizing your dashboard? Book your free consultation
Next Steps:
- Review your existing dashboards for any of the issues above.
- Audit your Google Sheets formulas and range references.
- Start pre-aggregating your data and limiting visible elements.
- Test your dashboard with multiple users to validate improvements.
Fast dashboards lead to fast decisions, and that’s a competitive advantage every team can benefit from. Try these tips on your next dashboard and share your results with us in our social media channels! For more tips, check out similar articles:
Power BI vs Looker Studio vs Tableau: The Best Data Visualization Tool in 2025 ,