Power BI vs. Looker Studio: How To Choose The Right BI Tool for Your Marketing Team in 2026

Introduction
Choosing the right Business Intelligence (BI) tool for your marketing team in 2026 can feel overwhelming. You’re constantly told to be “data-driven,” but which platform actually helps you turn campaign data, customer analytics, and social media metrics into actionable insights?
Two of the biggest names in the game are Microsoft’s Power BI and Google’s Looker Studio.
While both tools create stunning reports, they are built with fundamentally different philosophies. This guide will cut through the noise and compare them on the features that matter most to marketers in 2026:
- Data Connectivity: How easily can you plug in your marketing tools?
- Ease of Use: How quickly can your team start building reports?
- Data Modelling: What level of data transformation is possible?
- Collaboration & Sharing: How well does it fit into your team’s workflow?
By the end, you’ll have a clear understanding of which tool is the right fit for your team’s specific needs, budget, and existing tech stack.
Why BI Tools are a Marketer’s Superpower
In today’s marketing world, everything is measurable; from click-through rates and customer acquisition costs to social media sentiment and campaign ROI. But having data isn’t enough.
Raw numbers in a spreadsheet can be overwhelming and often hide the real story.
To help choose the right BI for marketing your team, is no longer a “nice-to-have” but a necessity. They empower marketing teams to:
Unify All Data: Pull data from Google Ads, Meta, Salesforce, and other platforms into a single view to get a true picture of the customer journey.
Deliver Smarter Insights: Go beyond basic metrics to track sophisticated KPIs, segment audiences with precision, and monitor competitor activity.
Adapt in Real-Time: Stop waiting for end-of-month reports. With live dashboards, you can spot trends, measure campaign performance, and pivot your strategy instantly.
A Quick Overview
1️⃣ Microsoft Power BI: An enterprise-grade, highly powerful BI tool that is part of the wider Microsoft ecosystem (Azure, Office 365, Excel). It’s known for its deep data modelling capabilities and is often favoured by teams with dedicated data analysts.
1️⃣ Google Looker Studio: A web-based, incredibly user-friendly tool that lives within the Google Marketing Platform. It excels at ease of use and seamless integration with Google products like Analytics, Ads, and Sheets, making it a natural starting point for many digital marketers.
Feature Breakdown: Power BI vs. Looker Studio
Now, let’s compare the platforms on the features that matter most to marketing teams so as to help choose the right BI for marketing your team.
1. Data Integration & Connectors
How well can each tool connect to the specific data sources a marketing team relies on every day?
The Verdict: Power BI has a larger library of native connectors, especially for enterprise and on-premise systems. Looker Studio focuses on seamless integration with the Google ecosystem and relies on third-party connectors for everything else.
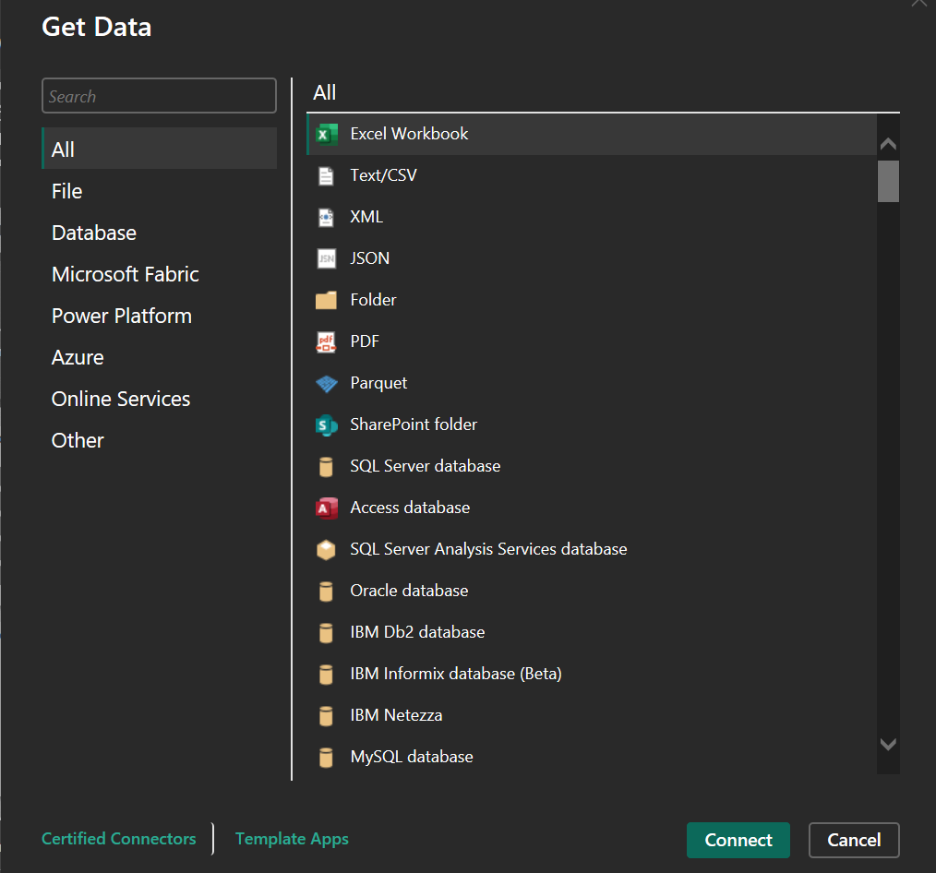
Power BI
Strengths: Boasts hundreds of native connectors, offering deep integration with the Microsoft suite (Excel, SharePoint, Azure) and enterprise platforms like Salesforce, SAP, and Oracle.
If your marketing data lives in a variety of corporate systems, Power BI’s breadth is a significant advantage. on the contrast, let talk about the weakness.
Weakness: Connecting to some Google Marketing Platform sources (like Google Ads or GA4) can sometimes feel less seamless than with Looker Studio.
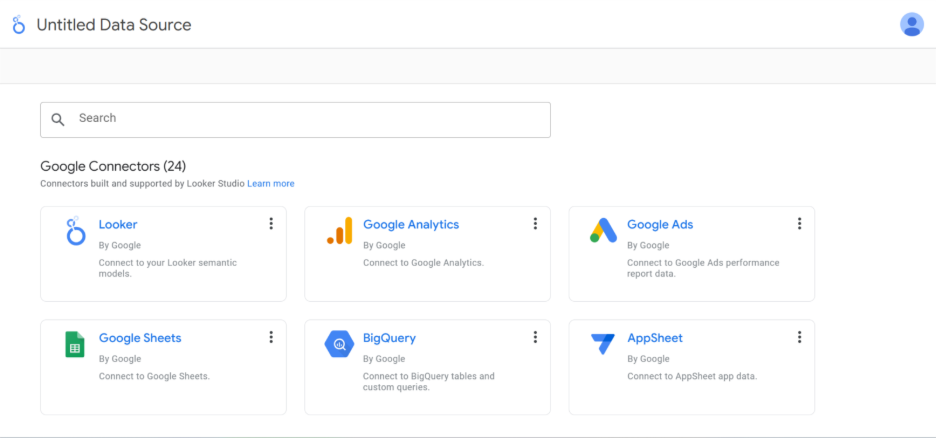
Looker Studio
Strengths: Offers flawless, one-click integration with the entire Google ecosystem (Google Analytics, Google Ads, BigQuery, Google Sheets).
It has strong integration capabilities with platforms like Amazon Redshift, and Snowflake, is optimized for integration with modern cloud-based data warehouses allowing real-time access to large datasets without the need for duplication or data movement.
This capability makes Looker a strong choice for organizations with cloud-first strategies that need live data connections and for teams heavily invested in Google’s marketing tools, this is its killer feature. However, it does have a weakness.
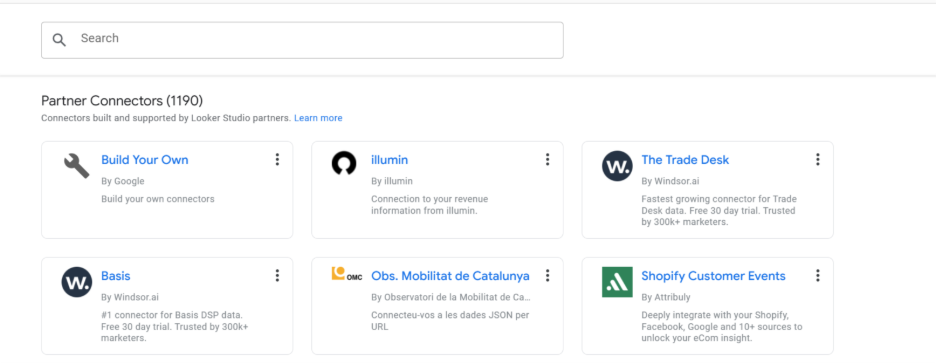
Weakness: For non-Google sources (like Meta Ads, LinkedIn Ads, or various CRMs), you almost always need to use third-party “Partner Connectors” (like those from Supermetrics), which often come with an additional subscription cost.
At this time, let talk about the ease of use in the next section.
2. Ease of Use & Learning Curve
How quickly can your marketing team, especially those without a data background, start building meaningful reports? This is often the most critical factor in tool adoption.
The Verdict: Looker Studio is significantly easier to learn and use for beginners, making it the winner for teams that need to get up and running quickly. Power BI is more powerful but comes with a steeper learning curve, especially when moving beyond basic dashboards.
Power BI:
Strengths: The desktop interface will feel familiar to anyone who has spent a lot of time in Microsoft Excel. The drag-and-drop report builder is intuitive for creating standard charts.
For teams already embedded in the Microsoft ecosystem, the initial learning curve can be lower.
Weaknesses: The complexity ramps up very quickly. Moving into data modelling, creating relationships between tables, alongside writing DAX (Data Analysis Expressions) for custom calculations requires a significant time investment and often the skills of a dedicated data analyst.
This can be a major hurdle for a typical marketing team.
Looker Studio:
Strengths: Looker Studio is designed for simplicity and speed. Its web-based, drag-and-drop interface is incredibly intuitive, allowing marketers to connect a data source (like Google Analytics) and build a professional-looking report in minutes, not hours.
There’s no complex data modelling layer to learn for basic reports.
Weaknesses: This simplicity comes at a cost. While you can perform some basic calculations, it lacks the deep, powerful data modelling and transformation capabilities of Power BI.
For complex, multi-source data mashups, you’ll need to prepare your data before it gets to Looker Studio. Along with this, let’s talk about data modeling and customization in the next section.
3. Data Modeling & Customization
This is about what happens “under the hood.” How well can each tool transform raw, messy data from multiple sources into a clean, reliable dataset ready for analysis?
The Verdict: Power BI is the undisputed winner here, offering a powerful, built-in data transformation engine. Looker Studio’s capabilities are far more basic, focusing on simple calculations and blending rather than deep data modeling.
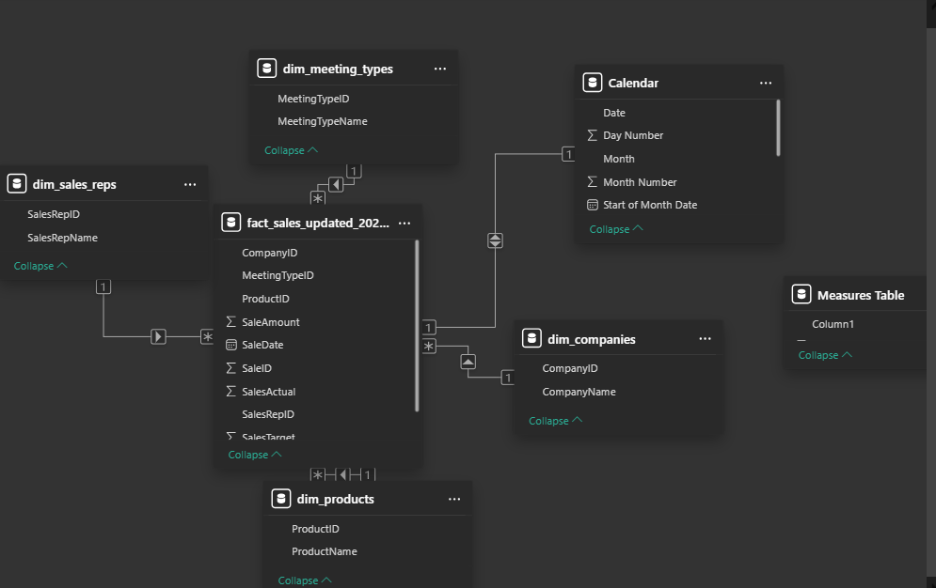
Power BI
Strengths: This is Power BI’s core advantage. It includes Power Query, a full-fledged ETL (Extract, Transform, Load) tool that allows you to clean, merge, and reshape data from various sources with a user-friendly interface. You can also build sophisticated data models by creating relationships between tables (star schemas). For custom metrics, its DAX (Data Analysis Expressions) language is incredibly powerful, enabling complex calculations like year-over-year growth or customer lifetime value.
Weaknesses: The power of Power Query and DAX comes with a steep learning curve. It requires a different way of thinking that can be challenging for marketers accustomed to spreadsheet formulas.
Looker Studio
Strengths: Looker Studio allows for creating calculated fields directly on charts, which is great for simple metrics (e.g., calculating Cost Per Click from Cost and Clicks). Its data blending feature lets you join data from different sources (like Google Ads and Google Analytics) directly in the interface, which is useful for straightforward comparisons.
Weaknesses: Its capabilities are very limited compared to Power BI. There is no equivalent of Power Query for complex transformations, and its calculated fields are not as powerful as DAX. For any serious data modeling, you must prepare and clean your data in another tool (like BigQuery or even Google Sheets) before bringing it into Looker Studio.
Having discussed the data modeling, consequently, we need to talk about how to effectively share the reports amongst your team members.
4. Collaboration & Sharing
Once you’ve built a report, how easily can you share it with your team, stakeholders, or clients? Effective collaboration is key to making data actionable.
The Verdict: Looker Studio wins for its sheer simplicity and frictionless, web-based sharing, which feels identical to using Google Docs. Power BI’s collaboration is powerful and secure but is more structured and deeply tied to the Microsoft 365 ecosystem.
Power BI
Strengths: Collaboration is robust and secure within the Microsoft ecosystem. You can publish reports to the Power BI Service (its cloud-based platform) and share them through workspaces, Microsoft Teams, or SharePoint. It offers granular, role-based access control, which is excellent for large organizations where you need to control who sees what data.
Weaknesses: Sharing with users outside your organization can be cumbersome and often requires them to have a Power BI Pro license, which can be a barrier for clients or external partners. The workflow is more rigid than Looker Studio’s simple link-sharing model.
Looker Studio
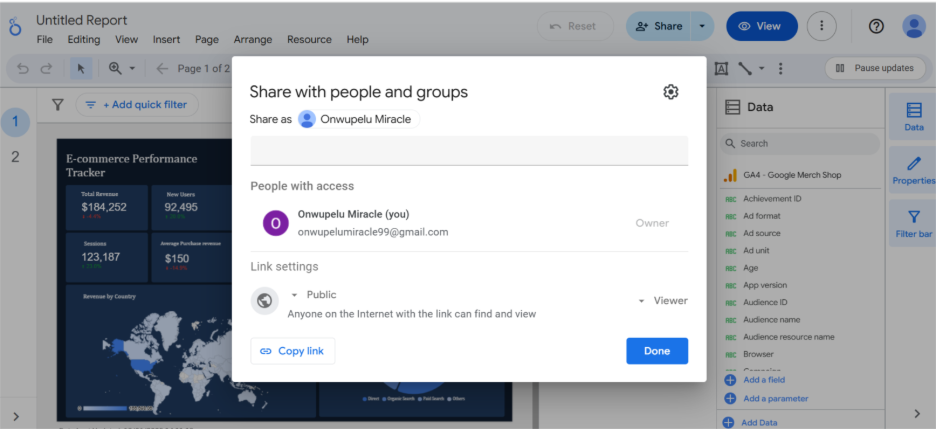
Strengths: Collaboration is Looker Studio’s most intuitive feature. Because it’s a web-based tool, sharing is as simple as clicking “Share” and sending a link, exactly like you would with a Google Doc or Sheet. Multiple users can view or even edit a report in real-time. You can easily embed reports into websites or internal portals, making it perfect for sharing live campaign performance with clients.
Weaknesses: While you can control view/edit access, its permission settings are not as granular or enterprise-focused as Power BI’s. For organizations with very complex data security and governance requirements, this simplicity might be a limitation.
In addition, a very crucial point to consider is the pricing of each of these BI tool, let get to it.
5. Pricing & Value for Money
Ultimately, the decision often comes down to budget. How much will each tool cost your team, especially as you add more users and data sources?
The Verdict: Looker Studio is the clear winner on price, as its core functionality is completely free. Power BI offers a “freemium” model, where individual use is free, but sharing and collaboration require a paid monthly subscription per user.
Power BI
Model: Freemium (Free for individuals, paid for teams).
Free Version (Power BI Desktop): You can download the desktop application for free and create complex reports on your own machine. However, you cannot share these reports with other users for collaboration.
Paid Version (Power BI Pro): This is the standard plan for teams and costs approximately £11.70 per user, per month. It’s required for each user who needs to publish, share, and view reports collaboratively. This is the most common plan for marketing teams.
Premium Version (Fabric Capacity): There are more expensive “Premium” plans that offer advanced features and larger data capacities, but these are typically aimed at large enterprises with dedicated data teams.
Bottom Line: For a marketing team to use Power BI effectively, you should budget for a Pro license for every team member who needs to create or interact with the reports.
Looker Studio
Model: Almost entirely free.
Free Version: Looker Studio is free to use. You can connect to your data, create unlimited reports, and share them with unlimited users at no cost. For most marketing teams, this is all you will ever need.
Optional Paid Version (Looker Studio Pro): There is a “Pro” version that costs around £7 per user, per month. This is not required for creating or sharing reports. It’s an optional upgrade for large organizations that need enterprise-level support from Google and advanced team management features.
Bottom Line: Looker Studio offers incredible value. A marketing team can build and share a comprehensive suite of professional reports without any subscription fees, making it an extremely budget-friendly choice. You only pay if you need the optional enterprise support features.
furthermore, let’s get to the data security and governance within the use of any of these BI tools.
6. Data Security & Governance
How well does each tool protect your sensitive marketing and customer data? This involves controlling who can see what and ensuring compliance with data privacy regulations.
The Verdict: Power BI offers a far more robust, enterprise-grade security framework with granular controls, making it the clear winner for organizations with strict compliance and data governance needs. Looker Studio provides simple, user-level security that is easy to manage but less powerful.
Power BI:
Strengths: Power BI inherits the comprehensive security infrastructure of the Microsoft ecosystem. It integrates deeply with Azure Active Directory for user authentication and allows for powerful Row-Level Security (RLS).
RLS is a killer feature that allows you to define rules so that different users see different rows of data in the same report (e.g., a regional marketing manager for the UK only sees UK data, while a global CMO sees all data).
It also offers data encryption and integrates with Microsoft Purview for advanced data governance.
Weaknesses: Setting up these advanced security features requires technical expertise and careful planning.
Looker Studio
Strengths: Security is straightforward and easy to manage because it’s tied directly to your Google Account and Google Workspace.
Access control is simple: you manage permissions at the report and data source level (Can View / Can Edit), just like with Google Docs. This is often sufficient for smaller teams or for sharing general marketing performance dashboards.
Weaknesses: Looker Studio lacks advanced features like native Row-Level Security. While you can create workarounds, it’s not a built-in feature. This makes it less suitable for scenarios where you need to share a single report with many users who all have different data access permissions.
The Final Verdict: Which Tool is Right for Your Team in 2025?
Now that we’ve broken down the key features, the choice between Power BI and Looker Studio becomes much clearer and depends entirely on your team’s profile.
Choose Looker Studio if your… ✅
- Team is heavily invested in the Google Marketing Platform (Google Analytics, Ads, BigQuery).
- Top priorities are ease of use, speed, and frictionless collaboration.
- Budget is a primary concern, and you need a powerful, free solution.
- Data is relatively clean, and you don’t need complex, built-in data transformation tools.
- You need to quickly build and share beautiful, interactive dashboards with clients and stakeholders.
In short, Looker Studio is the perfect BI tool for most agile, digital-first marketing teams who need to move quickly and prioritize data visualization over deep data modeling.
Choose Power BI if… ✅
- Your organization operates within the Microsoft ecosystem (Azure, Office 365, Teams).
- You need powerful data modeling and transformation capabilities to clean and merge data from many different, complex sources.
- Your team has access to, or includes, a data analyst comfortable with concepts like DAX and data relationships.
- You have strict data security and governance requirements, including the need for Row-Level Security.
- The subscription cost per user is not a barrier for your team.
In short, Power BI is the superior choice for larger organizations or marketing teams with access to analytical resources who require a robust, enterprise-grade platform for deep data analysis and governance.
Are you still confused on which tool to use? Reach out to us, and will help access your native business tools, team size, and technical know-how and advice on the best tool for you
You may also be interested in our full comparison of the three major visualisation tools.