Active vs Inactive Relationships in Power BI: What They Are and Why They Matter

When you start building data models in Power BI, one of the first things you’ll realize is that not all relationships behave the same way. Some automatically guide how your visuals filter and calculate — while others just sit there quietly, waiting for you to call them into action.
These two types are known as Active and Inactive Relationships. And understanding how they work can be the difference between a dashboard that tells the truth — and one that silently misleads.

In this guide, we’ll explore:
- What relationships mean in Power BI
- How to identify active vs inactive relationships
- When to use each type
- How to activate inactive ones with DAX
Prerequisites
Before we dive in, make sure you:
- Have Power BI Desktop installed
- Have a basic understanding of Power BI data modeling
Understanding Relationships in Power BI
In Power BI, relationships are the bridges that connect different tables together.
They tell Power BI how your data fits — and how it should flow across multiple tables.
For example, if you have a Patients table and an Appointments table, you can link them using the Patient ID column. Once connected, both tables behave like one unified dataset, allowing your visuals and calculations to pull insights from both sides.
You can think of relationships as SQL JOINS, but visually represented in Power BI.
There are four main types:
- One-to-One (1:1) – Each row in Table A matches exactly one row in Table B.
- One-to-Many (1: *) – One row in Table A relates to multiple rows in Table B (most common).
- Many-to-One (*:1) – The reverse of One-to-Many.
- Many-to-Many (*:*) – Multiple rows on both sides relate to multiple rows on the other.
But here’s where things get interesting — not all relationships are active.
Active Relationships
An active relationship is the main connection Power BI uses automatically when performing calculations or applying filters.
It’s represented by a solid line in the Model View.
Only one active relationship can exist between any two tables at a time.
Example:
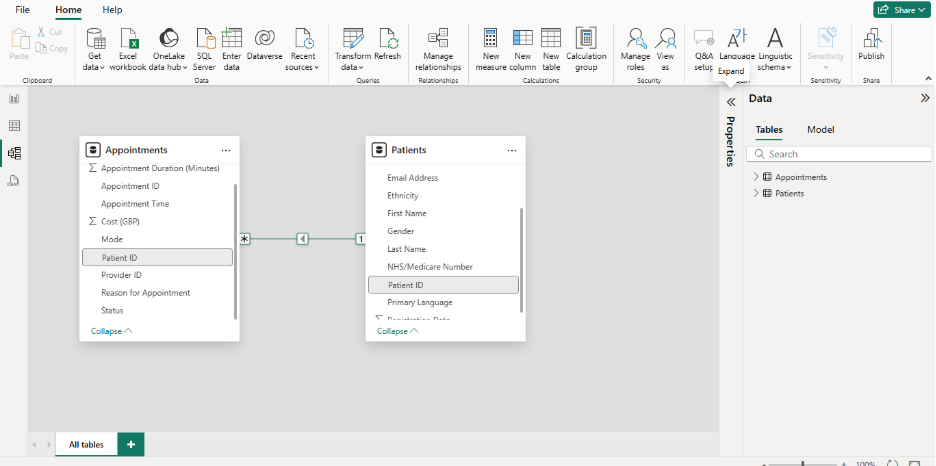
Let’s say you’re analyzing healthcare data with two tables:
- Patients – contains Patient ID, First Name, Last Name, Gender, Registration Date
- Appointments – contains Appointment ID, Patient ID, Appointment Date
Power BI will automatically create an active relationship between the Patient ID column in both tables.
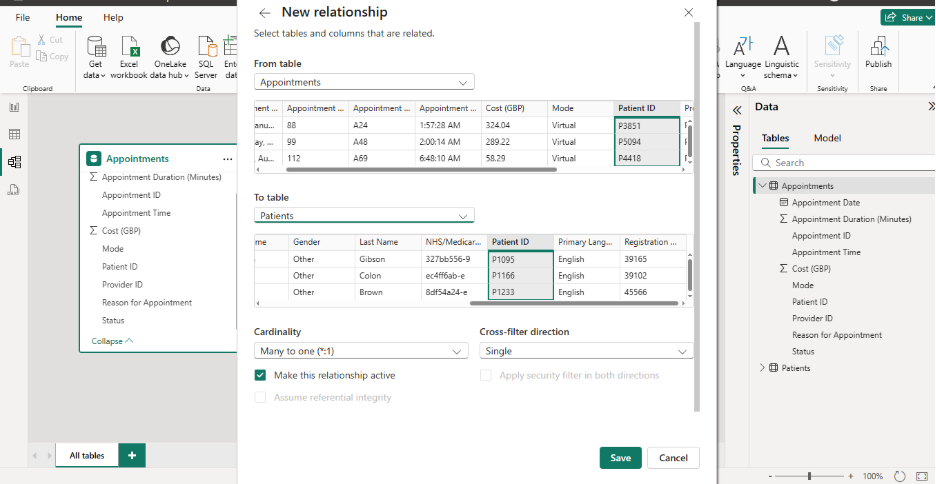
You can also create it manually by going to Manage Relationships → New → Make this relationship active.
Characteristics of Active Relationships:
Only one active relationship can exist between two tables
The default connection used in calculations
Represented by a solid line
Inactive Relationships
Inactive relationships are like backup routes in your model — they exist but aren’t used by default.
Power BI ignores them unless you specifically tell it not to.
They come into play when there are multiple possible connections between two tables and you want to switch perspectives without breaking your model.
Example:
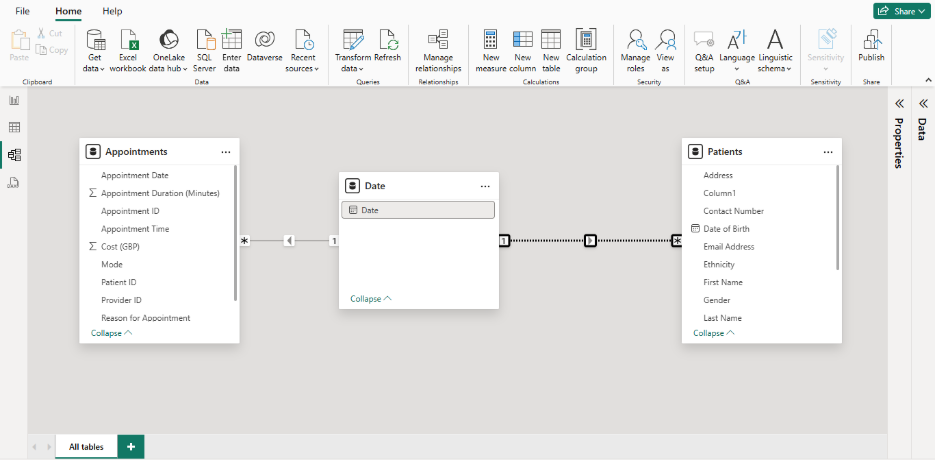
Continuing with our healthcare dataset — let’s introduce a Date table.
You might want to analyze trends by both:
- Patients’ Registration Date, and
- Appointments Date
To do this, you’ll create two relationships between your tables:
- An active one between Appointments[Appointment Date] and Date[Date]
- An inactive one between Patients[Registration Date] and Date[Date]
Inactive relationships are shown as dashed lines in the Model View.
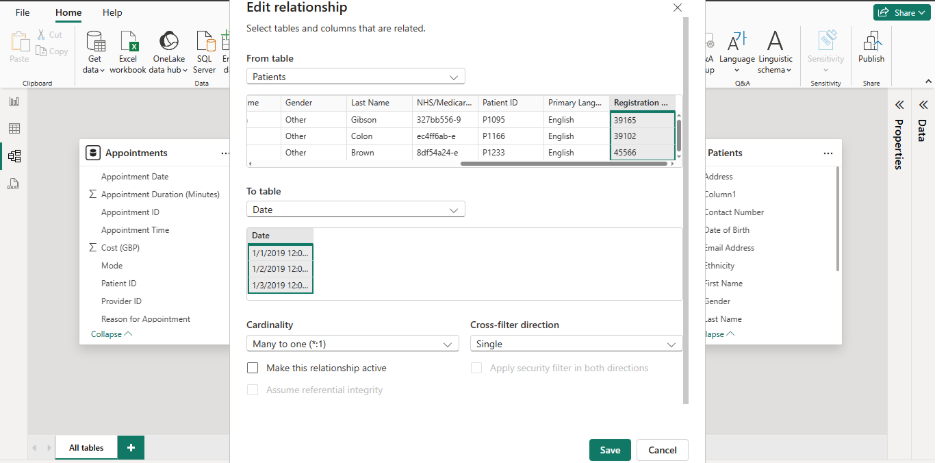
They’re not created automatically — you must create them manually by following the same steps as before, but leave the “Make this relationship active” box unchecked.
By default, visuals will only use the active relationship (Appointment Date).
If you want to temporarily use the inactive one (Registration Date), you’ll need to activate it using DAX.
Since the link between the patients and date table is inactive, attempting to filter by date in the Date table would only affect the Appointment table, via the active link. To use this inactive connection, you can use the DAX function USERELATIONSHIP.
Activating an Inactive Relationship with DAX
The USERELATIONSHIP() function lets you tell Power BI which relationship to use in a specific calculation.
Let’s say you want to calculate the number of appointments by registration date — but the Registration Date link is inactive.
You can activate it like this:
Appointment by Registration Date =

CALCULATE(

    COUNTROWS(Appointments),

    USERELATIONSHIP('Date'[Date], Patients[Registration Date])

)
This formula temporarily activates the inactive relationship for that measure, without changing your data model.
Characteristics of Inactive Relationships:
- Not automatically created
- Represented by dashed lines
- Require USERELATIONSHIP() to be used in calculations
Comparison
| Feature | Active Relationship | Inactive Relationship |
| Default Usage | Automatic. It is used for all filtering and calculations. | Ignored. It is not used for filtering and calculations by automatically. |
| Quantity Allowed | Only one allowed between any two tables at a time. | Multiple can exist between the same two table at a time. |
| Visual Appearance | Represented by a solid line in the model view. | Represented by dashed or dotted line in the model view. |
| Filter Propagation | Filters automatically flows along this path. | Filters do not flow along this path. |
| Activation Method | Used automatically. No special DAX function needed. | Must be explicitly activated for a specific calculation. |
When to Use Active Relationships
Use active relationships for:
- Default filtering – The main link between key tables (e.g., Date → Sales).
- Main metrics – If 90% of your visuals depend on one column, make that the active path.
- Row-Level Security (RLS) – RLS rules work only through active relationships.
When to Use Inactive Relationships
Use inactive relationships when:
- You have role-playing dimensions (e.g., one Date table linked to multiple date columns like Order Date, Ship Date).
- You want alternate business views (e.g., analyze sales by Manager ID instead of Team ID).
- You need specific DAX measures under a different filter context.
Final Thoughts
Relationships are the backbone of every Power BI model — they define how your data speaks across tables.
Active relationships keep your reports clean and predictable. Inactive relationships give you flexibility — letting you analyze your data from different angles without cluttering your model.
A well-designed model finds the right balance between both:
- Active for reliability,
- Inactive for versatility.
Mastering them ensures your Power BI reports always tell the whole truth, not just part of it.